Trend continuation strategies need two main elements for it to be successful. The first is a means to objectively identify if the market is indeed trending or not, and if so, in which direction is the market trending. The second element would be the exact entry point. Knowing the direction of the trend does not mean that you should just blindly pick a spot to enter a trade and hope that the price will continue in the same direction. Trend continuation traders would usually try to look for optimal entry points wherein the market is most likely going to start pushing in the direction of the trend once again. This could either be a breakout in the direction of the trend or a pullback.
This trading strategy is a trend continuation strategy that trades on pullbacks and makes use of the 50 SMA and RSI to identify trend direction, as well as the Heiken Ashi Candlesticks to serve as an entry trigger.
50 Simple Moving Average
There are many ways to identify trending markets and trend direction. Some use price action on naked charts, while others use technical indicators.
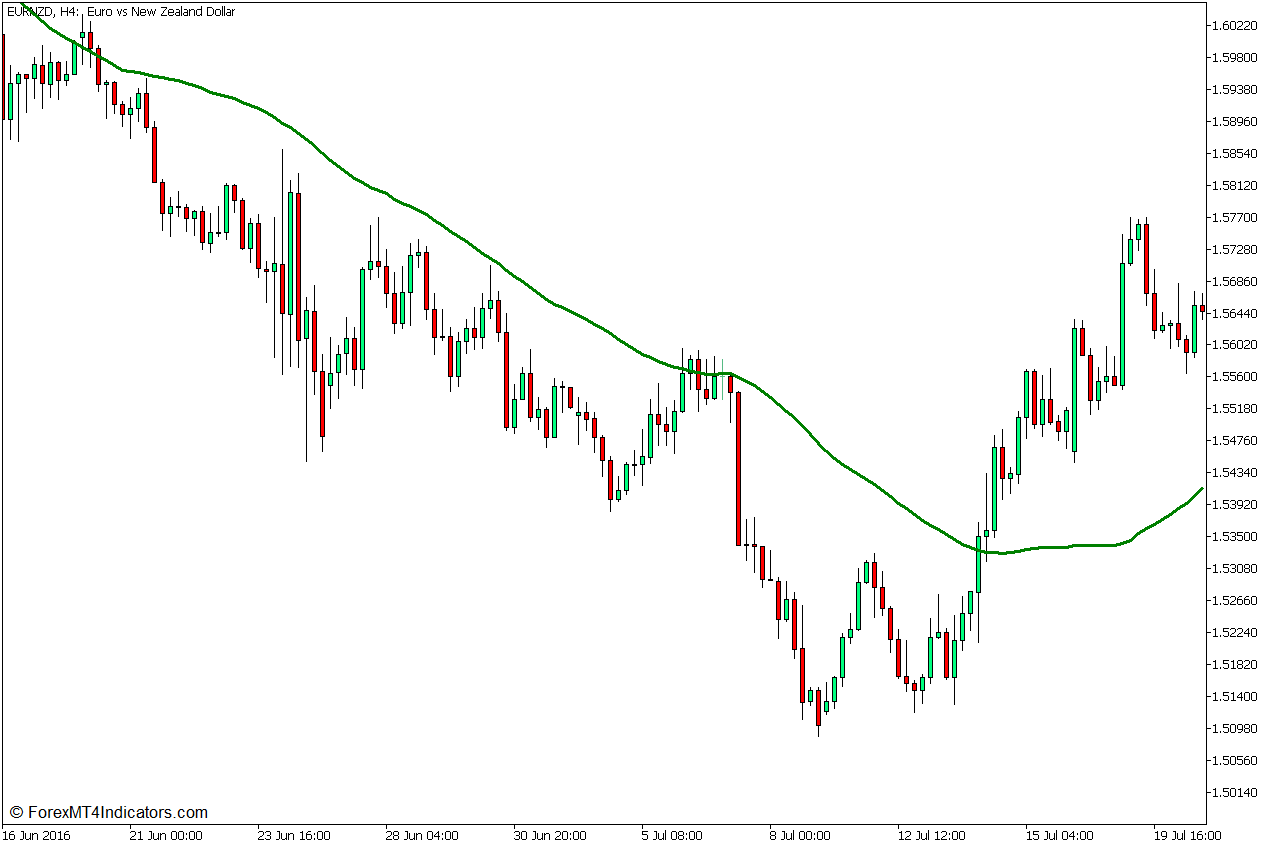
The 50-period Simple Moving Average (SMA) line is one of the most popular technical indicators that traders use to identify trend direction.
Price action tends to stay above the 50 SMA line whenever the market is in an uptrend, and below the 50 SMA line whenever the market is in a downtrend. The 50 SMA line also tends to follow where price action is causing it to slope in the direction of the trend.
The 50 SMA line can also act as a dynamic support or resistance level whenever the market is trending. Price can retrace back towards the 50 SMA line and then bounce back off it.
Relative Strength Index
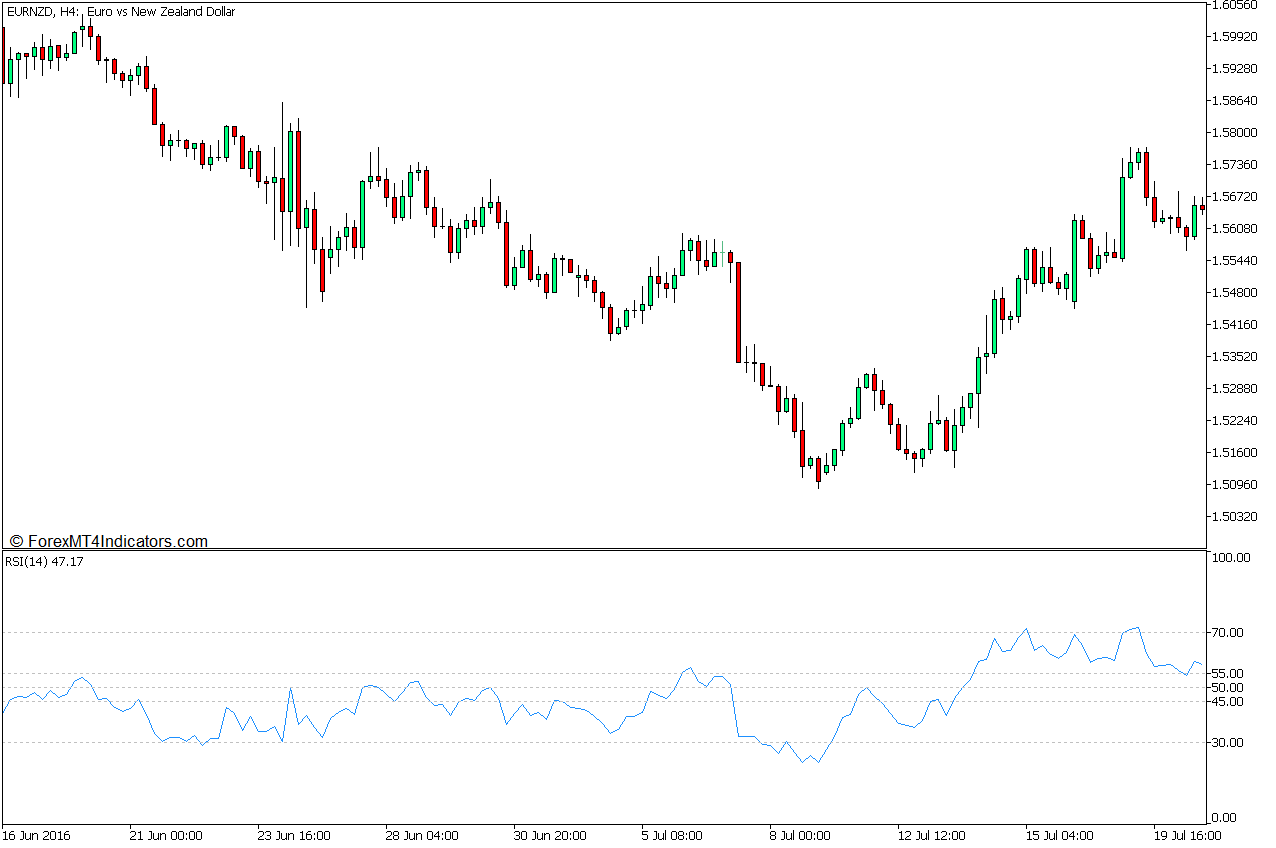
The Relative Strength Index (RSI) is a widely used oscillator type of technical indicator.
It plots a line based on recent price movements which typically follows the movements of price action. This line oscillates within the range of zero to 100.
The RSI is usually used as a mean reversal indicator. It has markers at levels 30 and 70. An RSI line below 30 signifies an oversold market, while an RSI line above 70 indicates an overbought market, both of which are prime conditions for a mean reversal.
Aside from this, the RSI line can also be used to identify trending markets. Traders can add levels 45, 50, and 55 to do this. The RSI line typically stays above 50 during an uptrend with 45 as the support level for the RSI. On the other hand, the RSI line also tends to stay below 50 during a downtrend with level 55 as a resistance for the RSI line.
Heiken Ashi Candlesticks
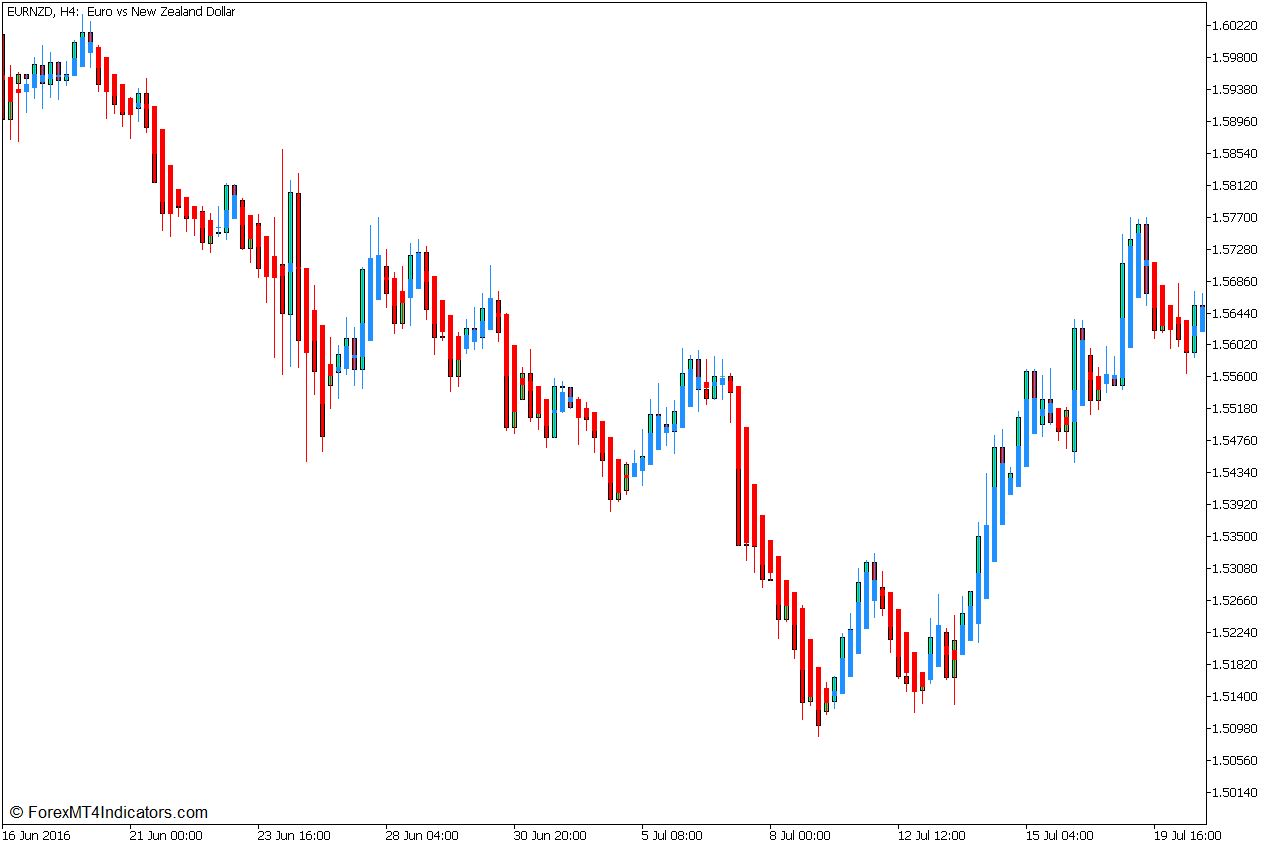
Heiken Ashi means “average bars” when translated from Japanese, and it is rightly done so.
Heiken Ashi Candlesticks modify the usual open and close of traditional Japanese Candlesticks. It computes the average price movements based on the highs, lows, and close of each candle and averages it out. This modification causes the Heiken Ashi Candlesticks to change color only when the short-term trend has reversed.
Although it plots the highs and lows of each bar as a wick, the opening and close of each candle is modified. As such, it is still best to overlay the Heiken Ashi Candlesticks on traditional Japanese candlesticks.
Given the short-term responsiveness of the Heiken Ashi Candlesticks, it would be a good indicator to use as a momentum reversal entry trigger.
Trading Strategy Concept
This trading strategy is a trend continuation strategy that trades on pullbacks using the 50 SMA line mainly as a dynamic support and resistance level.
The role of the 50 SMA line is first as a trend direction indicator. Traders may identify the direction of the trade based on where price action generally is about the 50 SMA line, the slope of the line, and the characteristics of price action.
The trend direction is then further confirmed based on where the RSI line generally is about the 50 markers, and whether the levels 45 and 55 are acting as support and resistance levels for the RSI line.
As soon as the trend direction is confirmed, we could then wait for pullbacks near the 50 SMA line. Trades are then confirmed whenever price action reacts to the 50 SMA line as a support or resistance level and is then confirmed by the Heiken Ashi Candlesticks changing color in confluence with the trend direction.
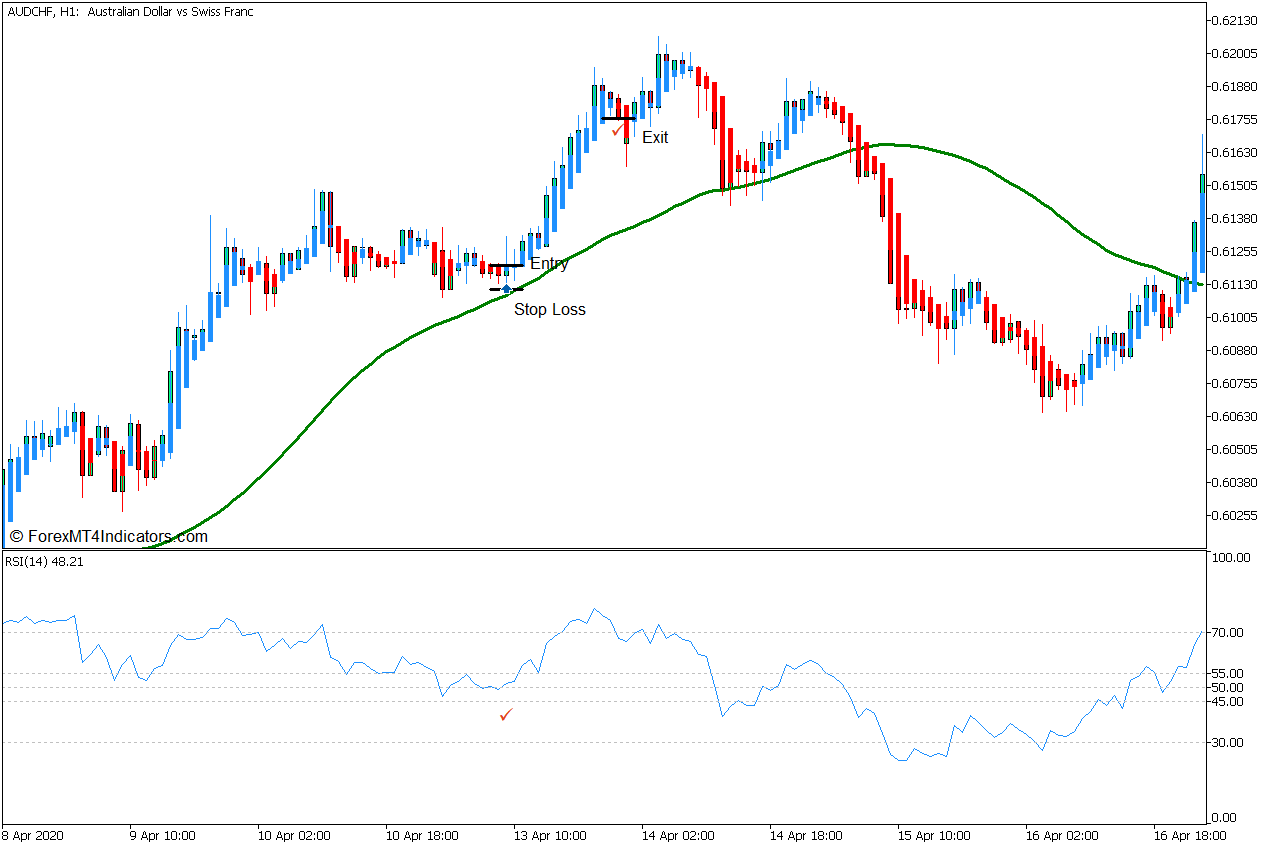
Buy Trade Setup
Entry
- Price action should trend up and stay above the 50 SMA line.
- The RSI line should stay above 45.
- Price action should retrace near the 50 SMA line and bounce off it.
- Enter a buy order as soon as the Heiken Ashi Candlestick changes to blue.
Stop Loss
- Set the stop loss on the support below the entry candle.
Exit
- Close the trade as soon as the Heiken Ashi Candlestick changes to red.
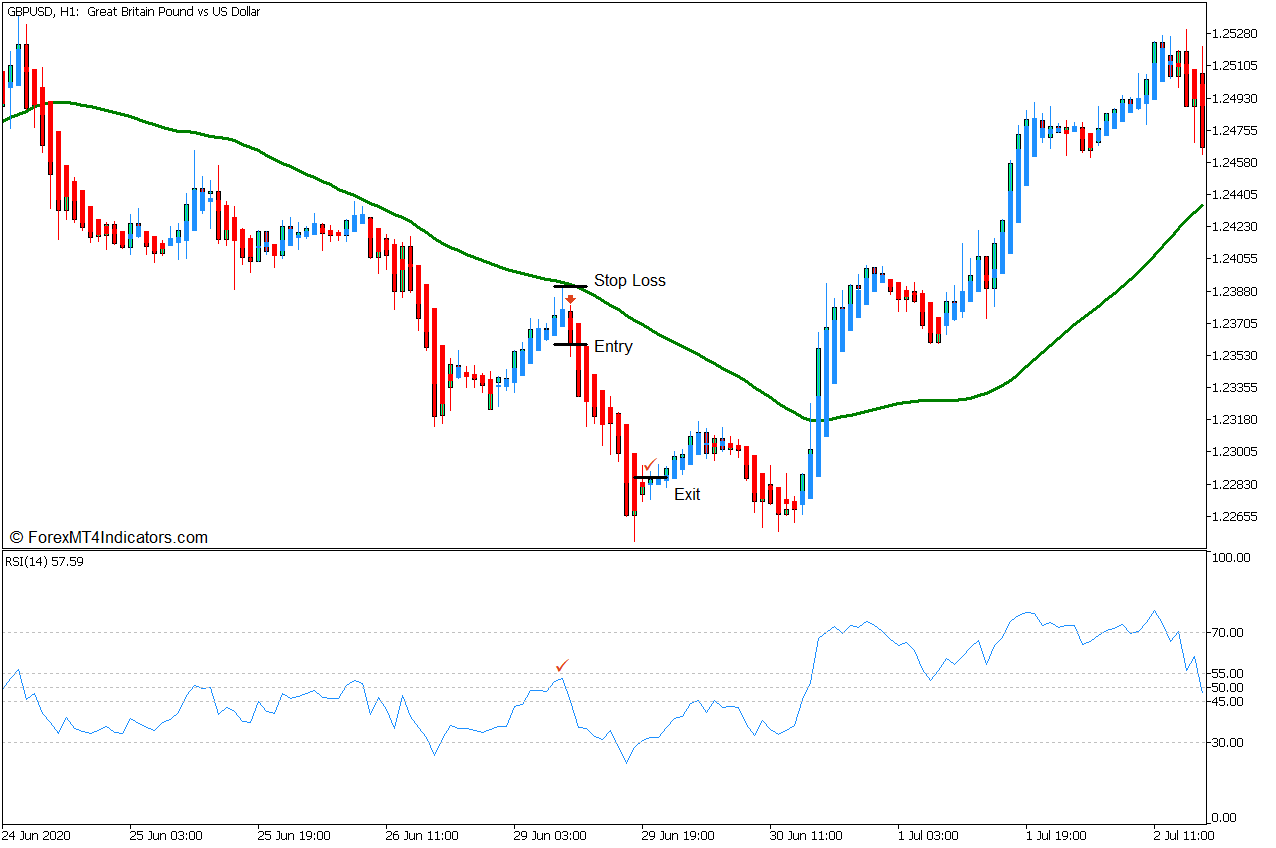
Sell Trade Setup
Entry
- Price action should trend down and stay below the 50 SMA line.
- The RSI line should stay below 55.
- Price action should retrace near the 50 SMA line and bounce off it.
- Enter a sell order as soon as the Heiken Ashi Candlestick changes to red.
Stop Loss
- Set the stop loss on the resistance above the entry candle.
Exit
- Close the trade as soon as the Heiken Ashi Candlestick changes to blue.
Conclusion
This trading strategy is a simple trend continuation strategy. It tends to work whenever the market is trending. However, some entry signals may not be exact and price action may continue to pull back.
Traders can use this strategy to trade on trending markets that have a strong momentum. This can be useful for traders who are still not proficient when trading solely based on candlestick patterns as the Heiken Ashi Candlesticks allow traders to use objective trade entry signals.
Recommended MT5 Broker
- Free $50 To Start Trading Instantly! (Withdrawable Profit)
- Deposit Bonus up to $5,000
- Unlimited Loyalty Program
- Award Winning Forex Broker
- Additional Exclusive Bonuses Throughout The Year

>> Claim Your $50 Bonus Here <<
Click here below to download:
Get Download Access
منبع: https://www.forexmt4indicators.com/50-heiken-ashi-trend-bounce-forex-trading-strategy-for-mt5/?utm_source=rss&utm_medium=rss&utm_campaign=50-heiken-ashi-trend-bounce-forex-trading-strategy-for-mt5