Now that you’ve got your Tipu RSI up and running, let’s learn how to decipher its signals. Just like any good language, the Tipu RSI communicates with you through its visuals. Here’s a breakdown of some key elements:
Key Levels and Signals: The Tipu RSI typically displays a line oscillating between 0 and 100. Levels above 70 generally indicate overbought conditions, while values below 30 suggest oversold territory. However, these are just general guidelines. Depending on your trading strategy and market context, these thresholds might need adjustment.
Divergences and Trend Confirmation: Divergences can be powerful tools in technical analysis. When the price makes a new high but the Tipu RSI fails to follow suit (bearish divergence), it can be a sign of potential weakness in the uptrend. Conversely, a bullish divergence (price making a new low while the Tipu RSI forms a higher low) might hint at a possible reversal in a downtrend.
For those unfamiliar, MT4 stands for MetaTrader 4, a popular platform used by millions of traders worldwide. The RSI, or Relative Strength Index, is a well-established indicator that measures the momentum of price movements. However, the Tipu RSI takes this concept a step further, offering traders a unique and potentially more user-friendly experience.
Tipu RSI offers a unique twist on the classic RSI, providing traders with a potentially more user-friendly and customizable experience. By understanding its core functionalities, interpreting its signals, and integrating it into a well-rounded trading strategy, the Tipu RSI can empower you to make more informed trading decisions.
Recommended MT4/MT5 Brokers
Let’s break things down into bite-sized pieces. First, it’s important to understand how the Tipu RSI differs from the standard RSI. While they both utilize the same core calculation, the Tipu RSI boasts some key distinctions:
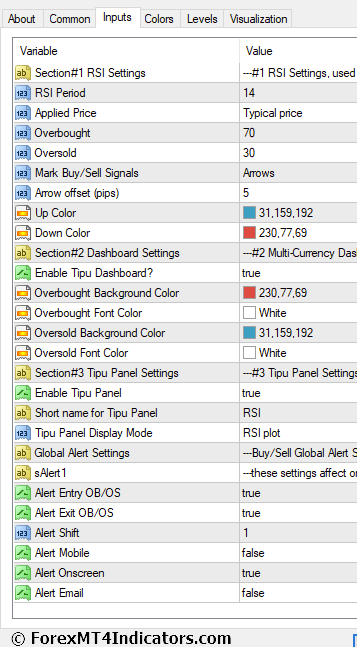
Customization: The standard RSI is a bit rigid in its presentation. The Tipu RSI shines by offering greater customization options. You can tweak parameters like the smoothing period and even alter the visual presentation on your charts for better clarity.
Presentation: Speaking of visuals, the Tipu RSI is typically displayed as a boxed panel, neatly consolidating the information and reducing chart clutter. This can be a lifesaver, especially when juggling multiple indicators.
Interpreting the Tipu RSI
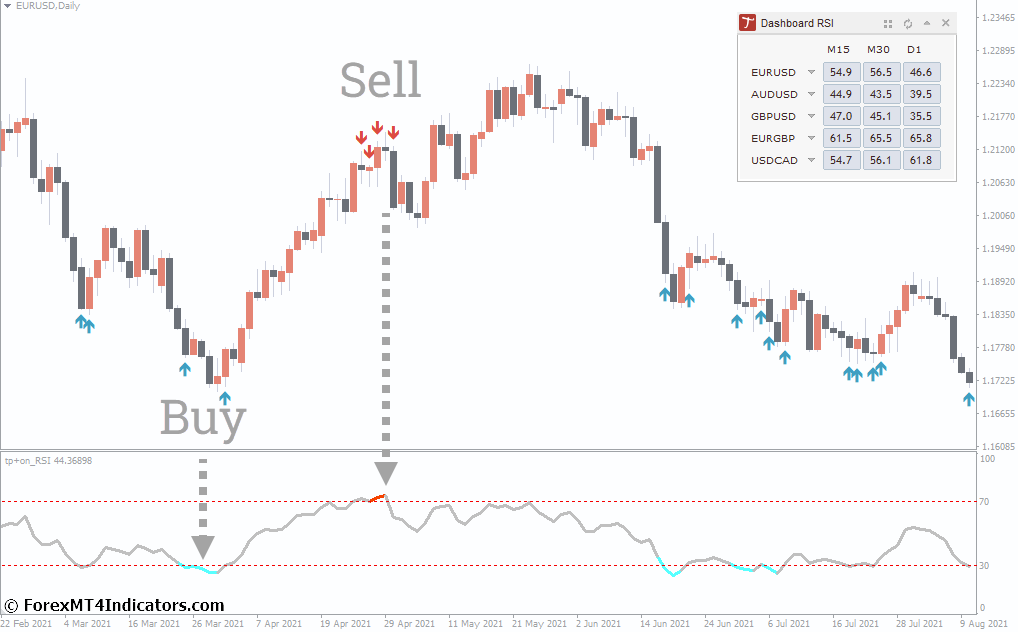
Buy Entry
Long Entry: Look for a situation where the Tipu RSI dips below 30 (oversold territory) and then starts to rise. This might indicate a potential reversal in a downtrend.
Confirmation: Ideally, this should be accompanied by a bullish price action confirmation signal, such as a break above a key support level or a bullish candlestick pattern.
Stop-Loss: Place your stop-loss order just below the recent swing low or support level, depending on the confirmation signal.
Take-Profit: There are two potential approaches:
Target Profit 1: Aim for a take-profit level near the 50 line (midpoint) of the Tipu RSI. This captures a decent portion of the potential upside move.
Target Profit 2: For a more aggressive approach, you can target a higher resistance level or a specific profit percentage based on your risk-reward ratio.
Sell Entry
Short Entry: Conversely, look for the Tipu RSI to climb above 70 (overbought territory) and then start to decline. This could signal a potential reversal in an uptrend.
Confirmation: Again, confirmation from price action is crucial. Look for bearish signals like a break below a key resistance level or a bearish candlestick pattern.
Stop-Loss: Place your stop-loss order just above the recent swing high or resistance level, depending on the confirmation signal.
Take-Profit: Similar to the buy signals:
Target Profit 1: Aim for a take-profit level near the 50 line (midpoint) of the Tipu RSI.
Target Profit 2: For a more aggressive approach, target a lower support level or a specific profit percentage based on your risk-reward ratio.
So, buckle up and get ready to unlock the secrets of the Tipu RSI! This comprehensive guide will equip you with the knowledge to confidently navigate this indicator and potentially elevate your trading game.
What Makes the Tipu RSI Tick?
(Free MT4 Indicators Download)
Before diving headfirst into live trades, it’s essential to understand the importance of backtesting. Backtesting essentially involves running your trading strategy on historical data to assess its potential effectiveness. This allows you to identify strengths and weaknesses, and ultimately refine your approach before risking real money.
FBS Broker
Trade 100 Bonus: Free $100 to kickstart your trading journey!
100% Deposit Bonus: Double your deposit up to $10,000 and trade with enhanced capital.
Leverage up to 1:3000: Maximizing potential profits with one of the highest leverage options available.
‘Best Customer Service Broker Asia’ Award: Recognized excellence in customer support and service.
Seasonal Promotions: Enjoy a variety of exclusive bonuses and promotional offers all year round.
The world of financial markets can feel like a whirlwind of charts, indicators, and complex jargon. But fear not, intrepid trader! Today, we’re diving into a powerful tool that can simplify your technical analysis and potentially boost your trading success.
Remember, these signals should be used in conjunction with other forms of technical analysis for a more well-rounded approach.
Advanced Strategies with the Tipu RSI
XM Broker
Free $50 To Start Trading Instantly!(Withdraw-able Profit)
Deposit Bonus up to $5,000
Unlimited Loyalty Program
Award Winning Forex Broker
Additional Exclusive Bonuses Throughout The Year
While the Tipu RSI can be a valuable asset in your trading toolbox, it’s crucial to acknowledge its limitations. Here are some key considerations to keep in mind:
False Signals and Market Noise: No indicator is perfect, and the Tipu RSI is no exception. There will be times when it generates false signals, especially during periods of high market volatility. It’s essential to combine the Tipu RSI with other forms of analysis and sound risk management practices to mitigate the impact of these false signals.
The Importance of Risk Management: This cannot be stressed enough. Always prioritize risk management in your trading endeavors. Define clear stop-loss levels to limit potential losses on any trade, regardless of the signals generated by the Tipu RSI or any other indicator.
How to Trade with Tipu RSI Indicator
Here’s how backtesting can benefit your Tipu RSI strategy:
Evaluating Performance: Backtesting allows you to gauge how your strategy, incorporating the Tipu RSI signals, would have performed in past market conditions. This provides valuable insights into potential profitability and helps identify areas for improvement.
Optimizing Parameters: Remember those customizable settings we discussed earlier? Backtesting can help you fine-tune the Tipu RSI’s parameters, such as the smoothing period, to potentially enhance its effectiveness within your specific strategy.
Limitations and Considerations
The Tipu RSI is a versatile tool that can be integrated into various trading strategies. Here are some ways to unleash its full potential:
Combining with Other Indicators: The Tipu RSI plays well with others! Consider pairing it with moving averages, MACD (Moving Average Convergence Divergence), or other technical indicators to strengthen your confirmation signals.
Developing a Trading System: Armed with your understanding of the Tipu RSI, you can craft your trading system. Define clear entry and exit points based on the indicator’s signals, combined with other factors like price action and support/resistance levels. Remember, backtesting is crucial before deploying any new strategy with real capital.