Click here below to download:
Elliott Wave Oscillator can be a valuable addition to your technical analysis toolbox, offering insights into potential wave dynamics and turning points in the market. While it shouldn’t be your sole decision-making factor, the EWO, when used strategically with confirmation from price action and other indicators, can potentially guide you toward informed entry and exit points for your trades.
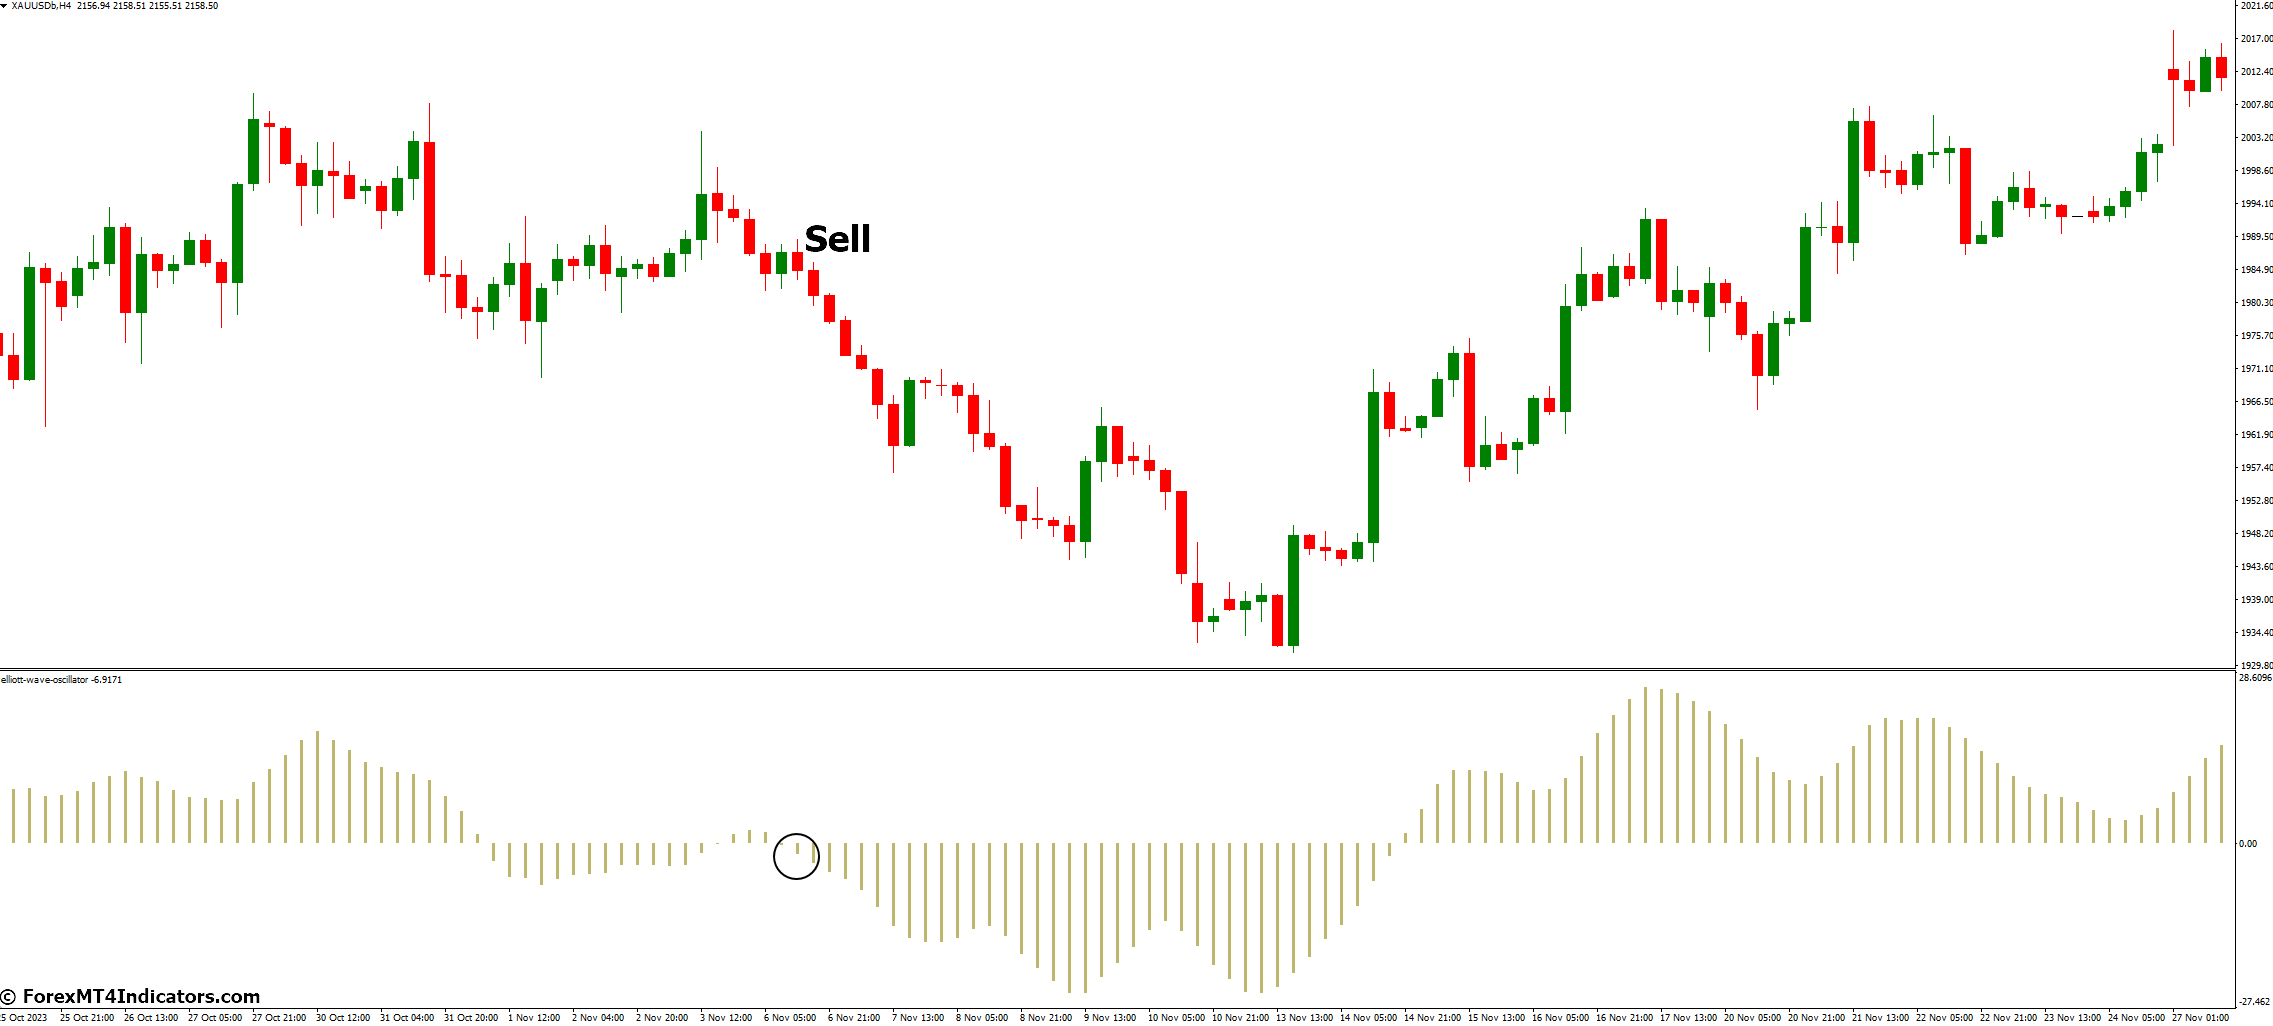
- EWO Signal: During a downtrend, look for the EWO to dip to very low readings, especially after a counter-trend rally (wave 4). This suggests potential selling pressure.
- Confirmation: Look for confirmation from price action, such as a breakdown below a support level, or a bearish candlestick pattern.
- Entry: Consider entering a short position after the confirmation signal is received.
- Stop-Loss: Place a stop-loss order above the recent swing high or resistance level to limit potential losses.
- Take-Profit: Potential take-profit levels can be based on predetermined risk-reward ratios or reaching historical support levels.
Conclusion
>> Sign Up for FBS Broker Account here <<
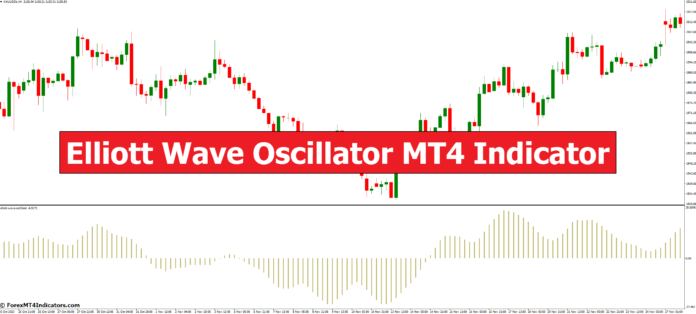
The EWO acts as a technical indicator designed to complement the Elliott Wave Theory. In essence, it aims to visualize the underlying momentum associated with each wave. Here’s a breakdown of its core components:
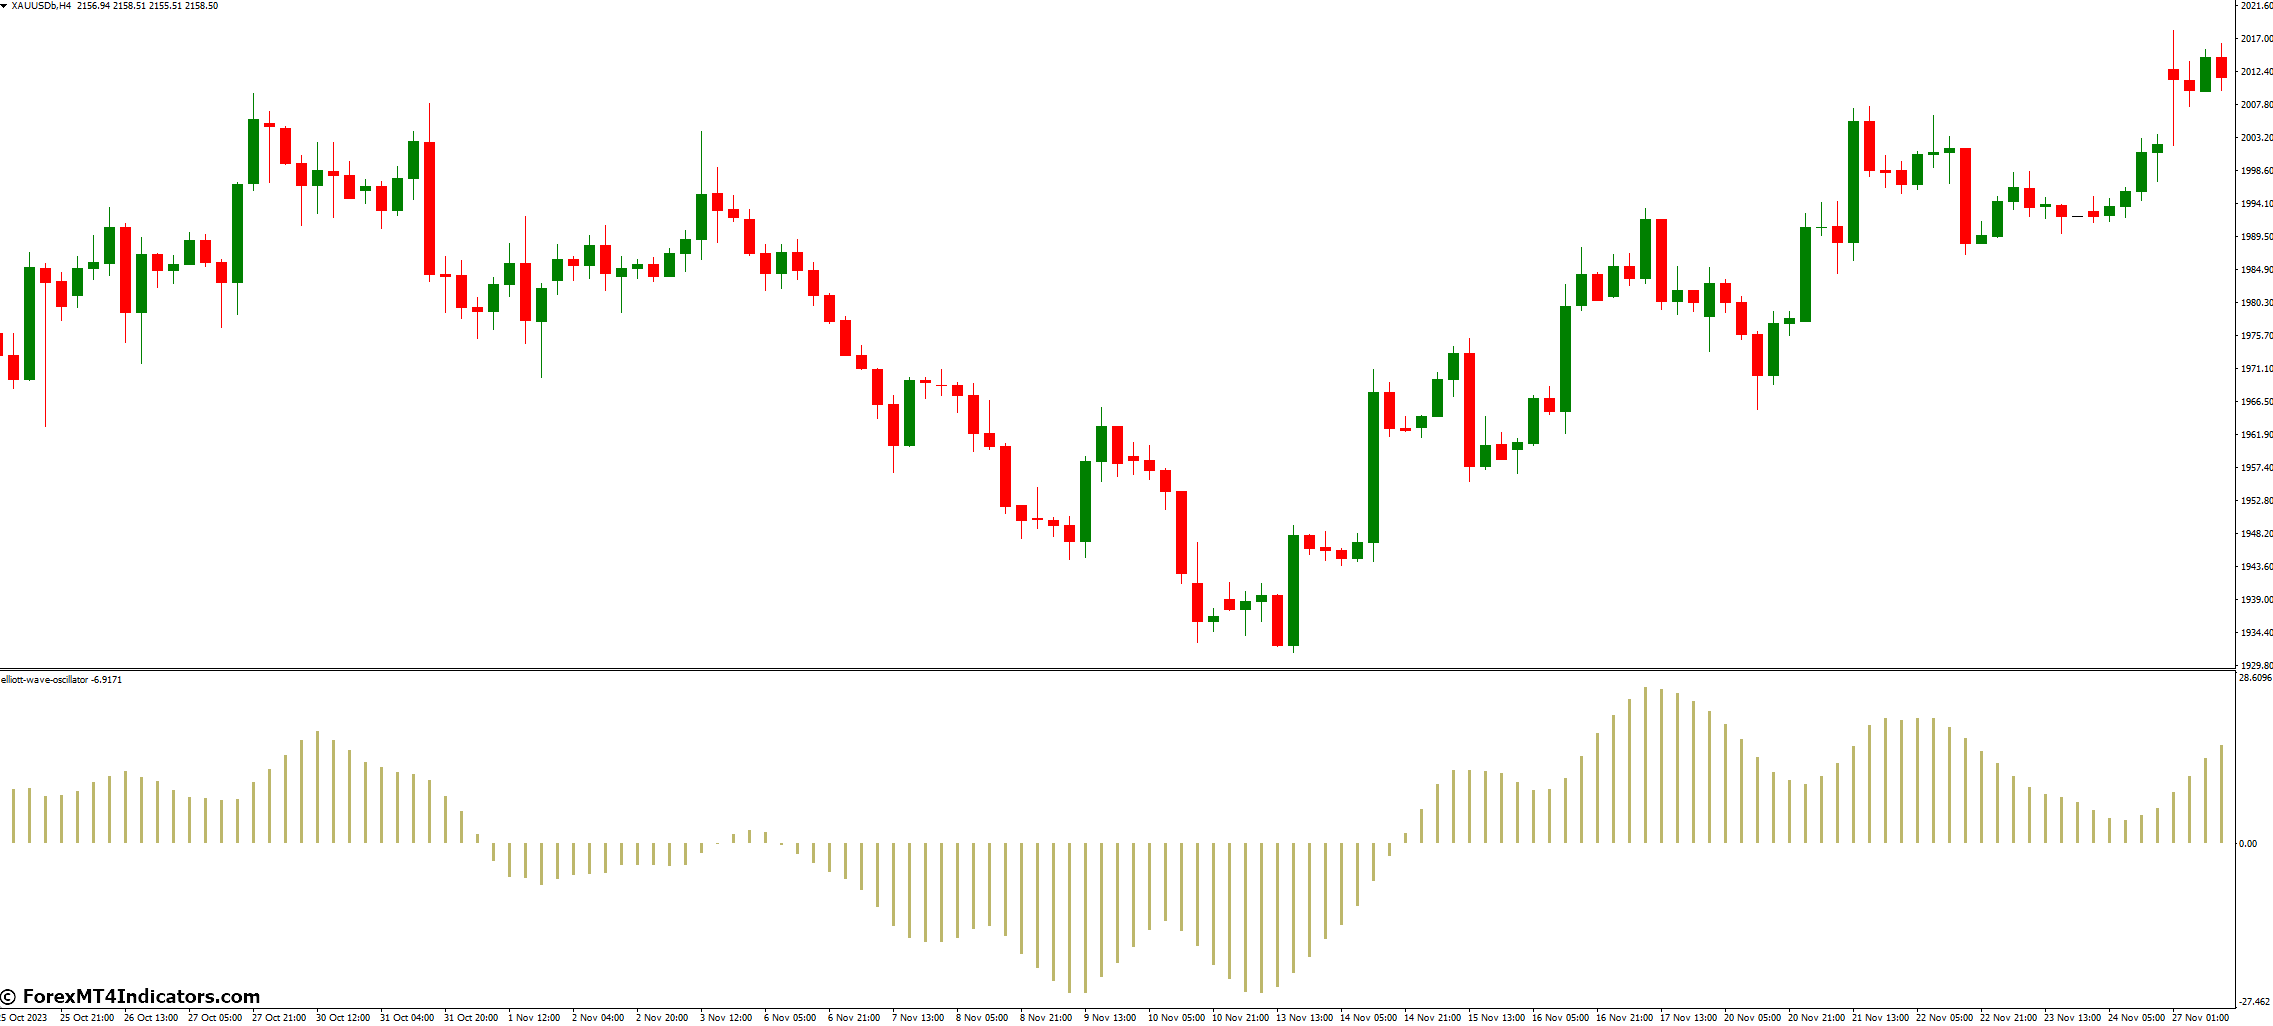
- Derivation: The EWO is a relatively simple mathematical formula. It calculates the difference between a short-term (fast) moving average and a longer-term (slow) moving average of a security’s price. This difference is then plotted as a histogram, with positive values displayed above the centerline and negative values displayed below.
- Interpretation of the Histogram: The EWO’s histogram readings can provide clues about the potential strength and direction of the current wave. Generally, high positive readings may suggest a strong motive wave (particularly wave 3), while low negative readings might hint at a corrective wave.
Identifying Potential Wave Endings with the EWO
XM Broker
- Free $50 To Start Trading Instantly! (Withdraw-able Profit)
- Deposit Bonus up to $5,000
- Unlimited Loyalty Program
- Award Winning Forex Broker
- Additional Exclusive Bonuses Throughout The Year
- EWO Signal: During an uptrend, look for the EWO to reach extreme highs, particularly following a corrective wave (wave 2). This suggests potential buying pressure.
- Confirmation: Look for a confirmation signal from price action, such as a breakout above a resistance level, or a bullish candlestick pattern.
- Entry: Consider entering a long position after the confirmation signal is received.
- Stop-Loss: Place a stop-loss order below the recent swing low or support level to limit potential losses.
- Take-Profit: Potential take-profit levels can be based on predetermined risk-reward ratios or reaching historical resistance levels.
Sell Entry
Before diving into the EWO itself, let’s establish a solid foundation. The EWO is intricately linked to the Elliott Wave Theory, a widely recognized technical analysis approach developed by Ralph Nelson Elliott. This theory posits that market trends unfold in a specific, five-wave structure. These waves can be broadly categorized into two types:
- Motive Waves (1, 3, 5): These waves propel the price trend in the dominant direction, be it up or down.
- Corrective Waves (2, 4): These waves act as temporary pauses or pullbacks that counter the prevailing trend.
FBS Broker
- Trade 100 Bonus: Free $100 to kickstart your trading journey!
- 100% Deposit Bonus: Double your deposit up to $10,000 and trade with enhanced capital.
- Leverage up to 1:3000: Maximizing potential profits with one of the highest leverage options available.
- ‘Best Customer Service Broker Asia’ Award: Recognized excellence in customer support and service.
- Seasonal Promotions: Enjoy a variety of exclusive bonuses and promotional offers all year round.

(Free MT4 Indicators Download)
One of the EWO’s primary strengths lies in its ability to potentially signal the conclusion of a particular wave. Here’s how to interpret the EWO’s readings in this context:
- EWO Readings for Motive Waves: During strong motive waves (especially wave 3), the EWO might reach extreme highs, potentially indicating that the momentum behind the trend is nearing exhaustion. This could be a signal for a potential trend reversal or the beginning of a corrective wave.
- EWO Readings for Corrective Waves: Conversely, during corrective waves, the EWO might display low negative readings, suggesting a weakening of the corrective move. This could indicate a potential resumption of the dominant trend.
- Divergences Between Price and EWO: A particularly valuable signal comes from divergences between the EWO and the price action. For instance, if the price continues to make new highs but the EWO fails to follow suit (bearish divergence), it might suggest a weakening uptrend and a potential reversal. Conversely, a bullish divergence (price making new lows while the EWO doesn’t) could indicate a potential reversal of a downtrend.
Crafting Winning Strategies
Understanding the Elliott Wave Theory allows you to identify potential turning points in the market, which is where the EWO comes into play.
Unveiling the Elliott Wave Oscillator (EWO)
The EWO’s potential to identify wave endings opens doors for developing trading strategies. However, remember that successful trading requires a confluence of factors, and the EWO should be used in conjunction with other technical indicators and sound risk management practices. Here are some pointers for incorporating the EWO into your trading toolkit:
- EWO Signals for Entering Long Positions: When the EWO reaches extreme highs during an uptrend, particularly after a corrective wave (wave 2), it could signal a potential buying opportunity. However, consider additional confirmation from price action or other indicators like the relative strength index (RSI) before entering a long position.
- EWO Signals for Entering Short Positions: Conversely, if the EWO dips to very low readings during a downtrend, especially after a counter-trend rally (wave 4), it might suggest a potential shorting opportunity. Again, seek confirmation from price action and other technical indicators before initiating a short position.
- Combining EWO with Other Technical Indicators: The EWO is a valuable tool, but it shouldn’t operate in isolation. Consider using it alongside other technical indicators like support and resistance levels, moving averages, or volume analysis to strengthen your trading signals.
How to Trade With Elliott Wave Oscillator Indicator
Buy Entry
منبع: https://www.forexmt4indicators.com/elliott-wave-oscillator-mt4-indicator/?utm_source=rss&utm_medium=rss&utm_campaign=elliott-wave-oscillator-mt4-indicator
Remember, successful trading requires a blend of knowledge, experience, and a healthy dose of caution. So, equip yourself with the necessary tools, practice with a demo account, and approach the markets with a well-rounded strategy.
Recommended MT4/MT5 Brokers
This guide, crafted with both beginners and seasoned traders in mind, will equip you with the knowledge to not only understand the EWO but also leverage it to potentially enhance your trading strategies. So, buckle up and get ready to unlock the secrets of this fascinating indicator!
Foundation of the EWO
>> Sign Up for XM Broker Account here <<
The world of financial markets can feel like a whirlwind of charts, indicators, and seemingly cryptic jargon. But fear not, intrepid trader! Today, we’ll be delving into a powerful tool specifically designed for navigating the sometimes choppy waters of price movements: the Elliott Wave Oscillator (EWO) for MT4.


