Let’s not take a deeper dive into the Connors RSI oscillator by studying its actual calculation.
There are many traditional technical indicators that traders can access through their charting platform. One of the more popular of these indicators is the RSI indicator. Although the traditional RSI indicator can be a great timing tool, there have been some efforts by traders to improve on it. In this lesson, we will discuss a variation of the RSI indicator, namely the Connors RSI indicator, which we believe to be a superior technical tool for short-term traders.
Connors RSI Indicator
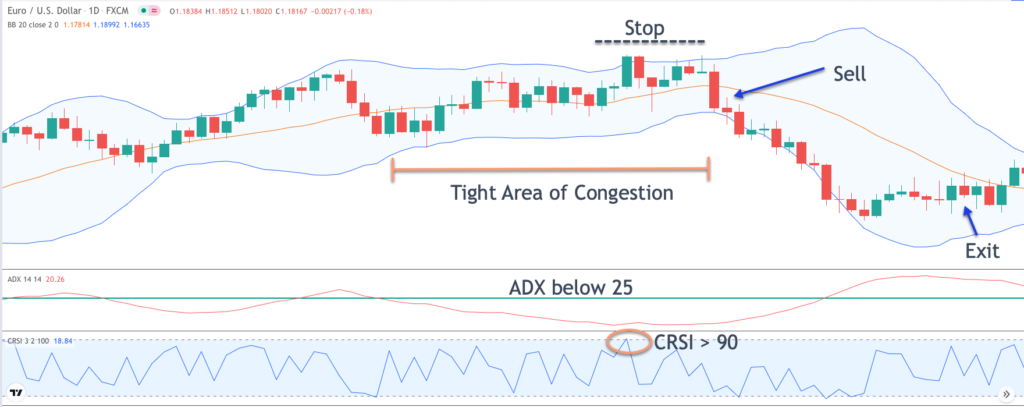
Now that we have outlined the rules for the CRSI trade strategy, let’s look at it in action. Below you will find the price chart for the EURUSD currency pair shown on the daily timeframe.
We illustrated a sample trading strategy using the Connors RSI indicator. This is just one of the many ways that it can be incorporated into your trading arsenal. Feel free to experiment with different strategies and techniques using CRSI until you find a mix that works with your style of trading.
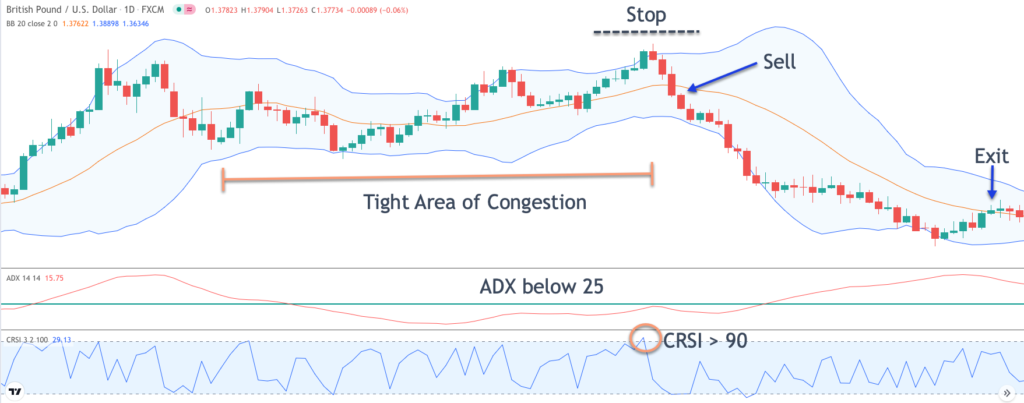
Let’s now move on to a second example of the Connors RSI 2 system in play. This time we will illustrate the strategy on the GBPUSD currency pair.
In this case, we can see that the ADX indicator has been moving below the 25 threshold suggesting a trendless or range bound market condition. As such, we could consider taking signals on either side of the market. If you look at the Connors RSI indicator once again, and refer to the orange circled areas, you can see how price reverted back to the mean after reaching these extreme levels. The first and last CRSI reading circled suggested an overbought market and prices snapped back lower afterwards. Similarly, the second and third CRSI readings circled suggested an oversold market and prices moved higher afterwards.
Connors RSI Trading Strategy
The Connors RSI indicator, commonly referred to as CRSI, is a momentum based indicator that tries to improve on the conventional RSI (14) indicator. This indicator was developed by Larry Connors. The aim was to create a variation that would adapt better to short-term changes in the market. Unlike the traditional 14 period RSI indicator, the CRSI utilizes a 2 period RSI as its look back input parameter. Moreover, the Connors RSI defines an overbought level that reaches a minimum of 90, or 95 in certain cases. This is in contrast to the traditional RSI indicator that uses 70 as its upper threshold for signaling an overbought market condition.
And here are the rules for a short position using the strategy:
- The Connors must register a reading of 90 or greater, indicating an overbought market condition.
- The Bollinger bands must be contracting, and the price action must display an area of tight congestion prior to a Connors RSI reading of 90 or higher.
- The ADX line must be below 25 at the time of the Connors RSI reading of 90 or greater.
- When all the above conditions have been met, a market order to sell will be entered upon closing below the median Bollinger band line.
- The stoploss will be placed at the recent swing high preceding the sell entry signal.
- The position will be held until the price touches the median line of the Bollinger band from below. This will serve as the exit signal.
Connors RSI Strategy in EURUSD
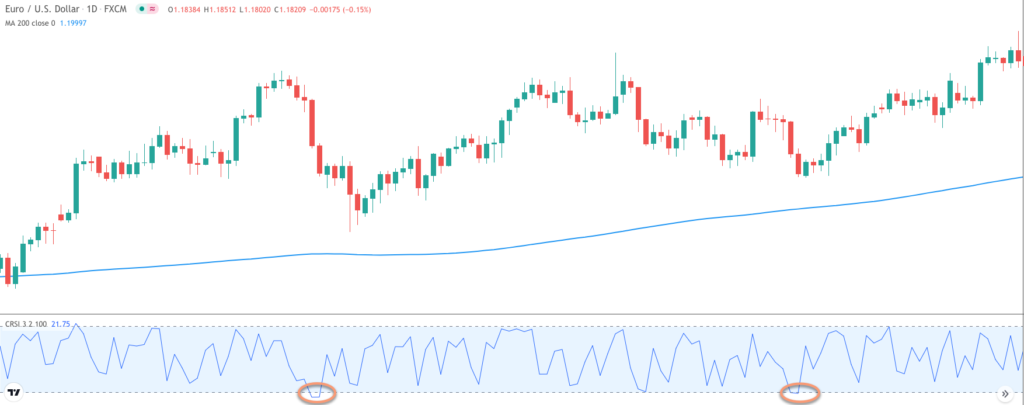
The Blue Line within the price chart represents the 200 period Simple moving average. The Connors RSI indicator is in the lower pane. Notice that the prices are trading above the 200 period SMA indicating an up trending market. You can see the two circled areas on the Connors RSI indicator wherein it registered and oversold reading. Subsequent to each pullback and oversold reading, we can see that the price reversed and continued higher in the direction of the uptrend.
Let’s now try to build a complete strategy based on the Connors RSI technical oscillator. The CRSI strategy that we will describe will consist of three technical indicators. The first will obviously be the CRSI oscillator, the second will be the Bollinger band study, and then the third and final indicator will be the average directional index indicator, or ADX.
منبع: https://forextraininggroup.com/ultimate-guide-to-the-connors-rsi-crsi-indicator/?utm_source=rss&utm_medium=rss&utm_campaign=ultimate-guide-to-the-connors-rsi-crsi-indicator
Connors RSI (3,2,100) = (RSI(3) + RSI(Streak,2) + Percent Rank(100)) / 3
Notice how price gains momentum to the downside after our sell entry was initiated. After a strong move lower, prices began to trade sideways in a very low volatility environment before making one final push lower. Afterwards, the price begins to retrace to the upside and eventually touched the centerline of the Bollinger band triggering our exit on the trade.
Summary
Connors RSI Trading Techniques
Within a trend based strategy, we would look for a bearish pullbacks within the context of an uptrend to enter into a long trade. Similarly, we would look for bullish rallies within the context of a downtrend to enter a short trade. The Connors RSI helps us in this regard by providing us an objective means by which to measure the probable terminal point of a bearish pullback or bullish rally. Let’s look at an example to demonstrate more clearly. Below you can see a price chart which displays the 200 period Simple moving average, and the Connors RSI indicator.
Looking at the price action towards the bottom left of the chart, we can see that the price began to move higher as it hugged the upper Bollinger band on its way up. Soon thereafter, we can see that a swing high was put in and prices began to retrace off of that area. From here prices began to consolidate in a sideways manner, and the Bollinger band began to contract creating a tight area of congestion.

Along the same lines, when applying the CRSI indicator to range bound markets, we want to use some technical based study, such as a Bollinger band or the ADX indicator, to help us gauge the volatility within the market and the mean reversion tendencies.
As you can see, the Connors RSI indicator is comprised of three parts. The first is the relative strength index, the second is the up and down streak length, and the third is the magnitude of price change.
The third and final component of the indicator seeks to analyze the price change between the most recent period and that of another specified period. The default of the other specified period is set at 100.
At the beginning of the chart, we can see that the price action is moving along in a range bound manner. Towards the middle part of the price chart, we can see that the Bollinger band is contracting as volatility is contracting. This creates an area of consolidation or tight area of congestion. Keep in mind, this is the condition within the market that we will need to see prior to initiating any buy or sell signals using this CRSI trading strategy.
On the chart above, we can see the price action at the top, and the ADX indicator in the middle pane, and the Connors RSI in the lower pane. The green line within the ADX indicator represents the 25 threshold. Remember when the ADX line is above the 25 threshold, that is indicative of a trending market condition, and when it is below the 25 threshold, that is indicative of a non-trending market situation.
The Connors RSI indicator can be used in both a trending market phase and during a consolidation or range bound market phase. Within the context of a trending market, we want to use a trend filter such as a simple moving average to determine the trendiness of a market and the direction of that trend, and then seek to fine-tune the entries using the Connors RSI extreme readings.
The first part of the indicator includes the relative strength index. More specifically, is a 3 period RSI of the price measured on a scale from 0 to 100.
The actual sell entry signal would occur upon a close below the centerline of the Bollinger band as can be seen on the price chart. The stoploss would be placed at the swing high immediately preceding the sell entry signal. After we have set our stoploss and protected ourselves against any adverse price moves, we would simply wait for price to touch the centerline of the Bollinger band once again from below. Immediately following the sell signal, prices move lower sharply. At some point, prices did begin to consolidate and move sideways, and touched the Bollinger band centerline. This would have served as our exit point on the trade.
Connors RSI System in GBPUSD
At this point, we would wait for a close below the center line of the Bollinger band. As soon as this event occurs, we would enter a sell entry order at the market. To protect ourselves in case of an adverse price move, we would place our stop loss above the most recent swing high as shown by the black dashed line noted as, Stop.
The Bollinger bands can be seen on the chart, and you can see how it acts to contain the price action within the bands. The center band colored in orange will represent our signal line. The ADX indicator is shown in the center pane. The red line within the ADX represents the ADX line, and the horizontal green line shown on the indicator represents the 25 threshold level. Last but not least, you can see the CRSI oscillator shown on the lower pane, and you can see the oscillation up and down as prices move between stages of buying and selling activity.
Generally, when the ADX indicator is above the 25 threshold, it is indicative of a trending market condition, and conversely, when the ADX indicator is below the 25 threshold, it is indicative of a non-trending market condition. And so, when we are looking for a rangebound market to trade, we could check to see if the ADX is registering a reading below 25. Below you can see a price chart which displays the ADX indicator along with the Connors RSI oscillator.
The strategy has a mean reversion component and can be described as a volatility breakout strategy. The strategy works on all liquid markets and time frames, however, it’s best to apply it on relatively higher time frames such as the four hour, eight hour, or daily charts.
So here are the rules for trading this Connors RSI strategy. Let’s start off by outlining the rules for a long position.
- The Connors RSI must register a reading of 10 or lower, indicating an oversold market condition.
- The Bollinger bands must be contracting, and the price action must display an area of tight congestion prior to a Connors RSI reading of 10 or lower.
- The ADX line must be below 25 at the time of the Connors RSI reading of 10 or lower
- When all the above conditions have been met, a market order to buy will be entered upon closing above the median Bollinger band line.
- The stoploss will be placed at the recent swing low below the buy entry signal.
- The position will be held until the price touches the median line of the Bollinger band from above. This will serve as the exit signal.
The second part of the indicator seeks to measure the length of a trend. More specifically, it is calculated as a 2 period RSI of the up/down streak. To clarify the up down streak, it is simply the length of consecutive time in which an instrument’s closing price is higher in the case of an up streak, or lower in the case of a down streak.
As we touched upon earlier, the Connors RSI indicator can be used to trade both a trend based strategy and a mean reversion based strategy. Again, the most important thing that we need to be aware of is the current market environment so that we can implement the best strategy based on those conditions.
More specifically, we want to confirm that the ADX indicator line is registering a reading below 25 at the time the CRSI indicator is above 90. Scanning the price chart once again, we can see that although the ADX line was moving higher just prior to the CRSI overbought reading, it failed to cross the 25 threshold. As such, all of the conditions for a short position in the GBPUSD have been confirmed.
The Connors RSI indicator is a great improvement over the traditional RSI indicator, particularly for shorter-term traders that need a more sensitive timing signal. The indicator is very versatile in that it can be utilized in both a trending environment, and a non-trending environment. However, traders need to be careful and ensure that they are aligning themselves with the current market condition.
And so, the Connors RSI indicator can be implemented in both trending and non-trending market environments. The most important aspect of successfully applying Connors RSI is determining the current market conditions and aligning your strategy accordingly.
Connors RSI Formula
As prices moved higher more sluggishly, it eventually created and overbought condition within the context of the CRSI. As can be seen within the orange circled area on the CRSI indicator, it reached a reading of greater than 90. This condition would have prompted us to position to the short side of this market. However, before we do, there is one last piece of confirmation that we need.
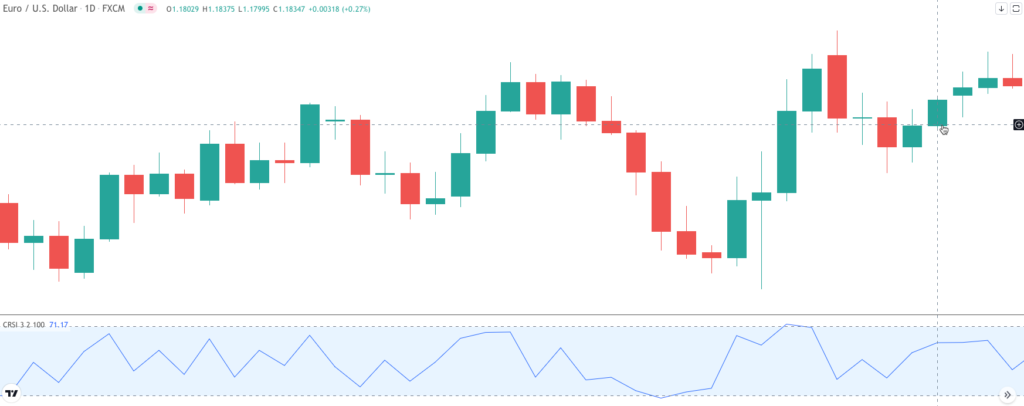
Similarly, the Connors RSI indicator defines an oversold level when it falls to a threshold of 10 or below. Again, this is in contrast to the traditional RSI oversold reading of 30 that is typically used. These revisions allow traders to take better advantage of short-term price movements. Here you can see the CRSI indicator plotted below the price: