Trading volume is the indicator of traders’ activity. The higher it is, the higher the liquidity of the asset and its volatility. The dynamics of changes in trading volume helps to find potential price reversal points and key levels and determine the trend slowdown zones. Trading volume is also used to confirm the trend and reversal patterns.
Read on to learn how to use this indicator and how it can help when building trading systems.
The article covers the following subjects:
What Is Volume of Trade?
Trading volume is the number of trades or bought/sold assets in a fixed time interval. It reflects the general interest of traders in a particular asset. The more trades conducted in the market and the larger their volumes, the higher the traders’ activity. High activity determines the high liquidity and volatility of the asset. Trading volume can be expressed in the number of stocks, lots, contracts, or monetary units.
Approaches to calculating trading volumes differ due to the specifics of collecting statistical information in different markets. Let’s look at examples of stock and Forex markets.
Stock market
Trading volume is the number of securities that have changed ownership in a fixed time interval. The data are calculated by the exchanges, and then the information is posted on the analytical portals or websites of the exchanges for public access.
Foreign exchange market
Trading volume is the number of all trades carried out in a fixed time interval. There is no technology in Forex that could accumulate data on the number and volume of all trades. Therefore, this indicator is approximate on trading platforms.
When using trading volume, it is important to consider its current value compared to previous periods. For example, ten market participants buy and sell 100 stocks each day. For the market, this is the average volume. Then a new participant appears who applies to buy 200 stocks at once. This is a large volume. Sellers immediately come to the market and offer their selling price. As a result, with increased demand, the stocks’ price rises sharply, trading volumes increase to 300 stocks, and volatility increases. The projected price increase attracts new market participants.
How Is Trading Volume Measured?
There is an Average Volume indicator in the stock market. This is the number of stocks bought and sold during one trading session. As a rule, the average value for a fixed period of time (usually 90 days) is analyzed.
In the Forex market, it is more difficult to calculate trading volumes since real data is unavailable here. The global Forex market is divided between the over-the-counter and futures currency exchanges, where derivatives (futures, options) are traded rather than currencies. Information on the number of transactions provided by individual currency exchanges is up-to-date. At Forex, it is not yet possible to get full information about all trades made.
How to Calculate Volumes in Forex
Although getting exact information about Forex trading volumes is impossible, several approaches allow traders to get average data.
Tick volume
A tick is the minimum price change. The tick value is the same as the pip (point) value for currency pairs and is equal to 0.00001 in five-digit quotes. For each candle, price fluctuations within its period are calculated.
Individual Broker Data
Brokers within their order processing system see all executed orders and can provide their average volume as input for indicator calculations. Thus, this parameter can be used to analyze the dynamics of volume changes.
Currency exchange summaries are published by ClusterDelta. The platform focuses on volume indicators, including those for MT4 and MT5. Some of them are available for free without a subscription.
Examples of Trading Volume Calculation
Let’s look at some examples of calculating the trading volume, depending on the type of market.
1. Exchange approach
Trading volume is calculated by the number of stocks involved in the transaction for a specific period.
Example 1. You bought 30 stocks and sold them on the same day. Your trading volume for the day was 60 stocks.
Example 2. You bought 100 Apple stocks and sold 50 Meta stocks. Another trader has bought 100 Meta stocks, including the 50 you sold, and is selling 50 Tesla stocks. The exchange turnover was 100 Apple stocks + 100 Meta stocks + 50 Tesla stocks = 250 stocks.
2. Quantitative approach
This approach sets the number of trades executed in a fixed period. The quantitative method allows tracking changes in the activity of traders but has a drawback as it does not consider the transaction volume itself. Supporters of the method argue that the appearance of a large order immediately triggers many small orders, increasing the volume. But this will only work if the asset is highly liquid.
3. Tick approach
This approach displays the frequency of price changes over a fixed time interval. For example, the number of moves per 0.00001 pip in 60 seconds for a minute candle is summed up. If an asset is of interest to traders, they enter many trades that will move the price by 0.00001 points in both directions. If there are few trades, then there will be fewer price movements. A high frequency of price changes means large trading volumes. Low frequency indicates low volumes. As a rule, this type of calculation is used in the OTC Forex market.
How Do You Find Volume In a Chart?
Trading volumes are displayed differently in the chart, depending on the indicator used. For example, it could be a curve overlayed on (VWAP indicator) or below (Volume Oscillator, OBV indicators) a price chart. But more often, a histogram with colored bars (Volume indicator) is used.
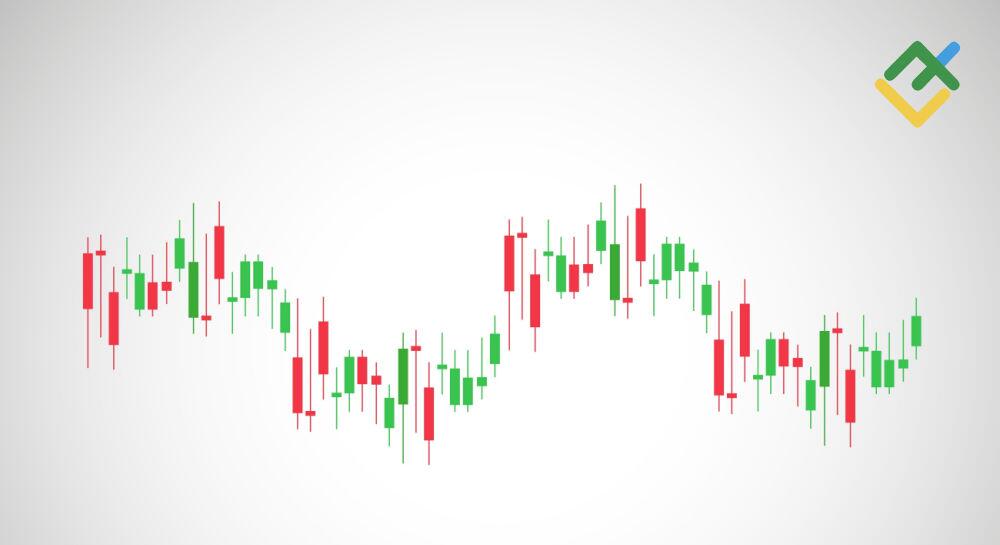
Above is an example of vertical volumes. The green bar indicates that the current candle has more trading volumes than the previous one, while the red bar means less. A series of red bars means decreasing volume.
Why are trading volumes important for traders?
The indicators below provide traders with an understanding of trading volumes and how they change over time.
Asset liquidity level
On the exchange stock market, stocks with a turnover of up to 300 thousand per day are considered low-liquid. They have a wide spread and a high risk of deep corrections. For intraday strategies or scalping, stocks with a trading volume of 1-5 million per day are more suitable.
Stocks with high volume (from 10 million per day) are considered heavy. Small orders can not significantly affect the price. The orders of large institutional investors, which instead of speculative intraday trading, use positional trading, can change the price.
Volatility level
When a price change coincides with an increase in volumes, this indicates the activity of traders and the continuation of the trend. Rising prices and volumes indicate that more buyers are entering the market. A price decline indicates that more traders are selling the asset, pushing the price further down. The larger the trading volumes, the greater the volatility.
Identifying potential trend reversal levels
The decrease in trading volumes after intensive growth suggests that traders are sticking to the wait-and-see approach. The trend may go flat or change direction.
Identifying false breakouts of key levels
Stop-losses and take-profits are often set at key levels. If the price breaks out key levels or a trend line, and at the time of the breakout, an increase in volumes is visible, the breakout may mean a trend movement. If the volumes at the time of the breakout are unchanged or decreasing, then the breakout is false. The same applies to reversal patterns. The significance of the reversal pattern confirms the growth of traders’ activity.
Tracking trading volume changes allows traders to earn by taking into account the volumes in the trading system. For example, traders understand that trading activity decreases towards the end of the working week or holidays, which means a decrease in volumes. Conversely, a new week may start with a sharp increase in volumes and cause an imbalance toward buyers or sellers, which will cause a gap. So traders need to limit risks or close trades before the weekend.
How to conduct technical analysis of trading volumes
The results of volume analysis can be used to identify a trend or correction.
-
For example, after a flat, the appearance of a trend and an increase in volume confirms the trend. If the volumes have decreased or the histogram bars are horizontal, then the price is going flat.
The first downtrend is confirmed by an increase in volumes. Then the volumes fall, the price is in a flat and practically does not change. Thus, due to the lack of trades, candles have small bodies. Then a downward movement begins again, confirming the increase in traders’ activity with a large volume compared to the previous period.
-
After a downtrend, the price reversed up. If the volumes are decreasing, this indicates a correction. The decline after it will continue. In turn, the visible increase in volumes indicates that a change in price direction is accompanied by an increase in the activity of traders, which indicates a change in the trend direction.
There is a downtrend. With the subsequent upward reversal, the volumes began to decline, which indicates not a new uptrend but a correction. With the continued downward movement, volumes began to rise again, confirming the trend.
The horizontal price movement was accompanied by equal relatively small volumes. Then traders’ activity began to increase. This is the first sign that the price will soon come out of the flat (while the exact future direction of the breakout is unknown).
With an almost twofold increase of the histogram bars, something similar to a pin bar appears in the chart after a series of growing candles. Then a large down candle (similar to the engulfing pattern) and another down candle (1) appear while the histogram bars continue to grow. This indicates a continuation of a strong downward movement.
After a long downtrend, a mirror situation appears. Candle (2) could be a correction, but large trading volumes remain at their high. Therefore, we can assume that there has been a trend reversal. Volumes begin to decline on a candlestick (3), indicating the end of the uptrend. The price again turns into a flat with small fluctuations within the range. Volumes are even and relatively small.
Trading volumes in a bull market
In a bullish market, volumes are explained as follows:
1. The volume is growing, traders are supporting the rising price, the number of buy orders is increasing, and activity is growing. This situation is often found in the cryptocurrency market. Any positive news is perceived as a signal for another incredible growth, as a result of which inexperienced traders buy coins, the price of which is growing due to an artificial increase in demand. Also, this situation can be observed during a short squeeze.
This is an example of a GameStop short squeeze. Stock prices increased after the growth of buyers’ activity and the forced closing of short trades by stop by sellers.
A very rapid growth in stock trading volumes may indicate the imminent end of the trend. A situation will arise when there are many sell orders at the maximum price, but there are no buyers. After that, a rapid price decline will begin.
2. Volume is decreasing as traders are not interested in entering trades. Placed purchase orders are not met because there are no sellers. This indicates that the uptrend will soon reverse.
It is better to back up such signals with additional information such as reversal patterns, key levels, etc.
Trading volumes in a bear market
In a bear market, volumes are explained as follows:
-
The volume is decreasing, and traders are not ready to further accelerate the price. Sellers are not ready to sell the asset at the minimum price, while buyers expect the price to fall even lower. Then there comes a moment when activity and volumes become minimal, after which buyers begin to buy the asset. As a result, the trend reverses after an increase in demand.
-
The volume is growing, which may indicate a growing panic. Traders massively sell the asset. The lower the price falls, the more people want to get rid of it.
This example shows the massive sale of the Swiss bank Credit Suisse stocks in the spring of 2023 after it was on the verge of bankruptcy. You can see high trading volumes due to panic selling as the price falls.
High vs. Low Volume
Below is an example of defining high and low stock volumes:
-
High volume. Buyers receive a signal in the form of positive financial statements and begin to buy stocks. Sellers have been waiting for a price increase for a long time in order to sell stocks as profitably as possible. The number of buyers is growing, with an increase in demand, the price goes up, and the number of sellers is also growing. At some point, the number of buyers of an asset that has risen in price becomes smaller, volumes fall, and the price stops growing.
-
Low volume. There are practically no trades in the market. If there is someone willing to sell an asset, there are no buyers. Orders in the Depth of Market remain until some want to enter trades. The price at this time will be in a flat.
The main reason for the change in volumes is the reaction to the news.
Volume as a Technical Indicator
Volume indicators are divided into two groups:
-
Vertical ones are displayed in the chart as a vertical histogram, where the column corresponds to the volumes on a separate candlestick.
-
Horizontal ones are displayed in the chart as a horizontal histogram. They show strong resistance and support levels, at which a lot of pending orders are set, and the activity of traders is growing.
Market Profile is an example of a popular horizontal indicator.
The chart shows that the levels of the largest horizontal volumes approximately coincide with the price median. The further the price moves away from its average value, the less traders’ activity and the greater the possibility of a reversal.
Horizontal volume indicators are not included in the standard set of platforms (they are added separately).
Let’s consider the vertical volume indicators found on most trading platforms.
Volume Oscillator
The Volume Oscillator is an indicator that shows the difference between two moving averages of the trading volume. It is calculated by the formula:
VO = ЕМА1 (Volume) − EMA2 (Volume),
where EMA1 is the fast volume moving average, and EMA2 is the slow volume moving average.
Indicator signals:
-
If the fast MA is above the slow one, the oscillator is above the 0 level, confirming the uptrend. If the slow moving average is higher, the oscillator goes below 0, the volume drops.
-
If the oscillator crosses the zero level upwards, it indicates that the volumes are growing, which means that the current trend is likely to continue.
-
Divergence.
If the indicator is near zero and below, it indicates low trading volumes and confirms the flat on the daily interval. Also, candles with a small body confirm the flat market. Then the price starts to rise. The coincidence of the VO growth with the price growth indicates an increase in the traders’ activity. OSV crossing the zero level confirms the uptrend continuation.
OBV indicator
The On Balance Volume (OBV) indicator was developed by Joseph Granville in 1963. It is used to measure the flow of an asset’s trading volume to assess the balance of power between buyers and sellers in financial markets. It helps to determine the trend’s direction and the potential trend’s strength.
It is calculated by adding or subtracting the trading volumes, depending on whether the closing price was higher or lower than the previous closing price. If the closing price is higher, the trading volume is added to the previous OBV. If the closing price is lower, the trading volume is subtracted from the previous OBV.
Indicator signals:
-
The OBV growth is considered as an advantage for buyers over sellers and suggests that the price may continue to rise. An increase in trading volumes, coinciding with an increase in prices, confirms the continuation of the uptrend.
-
If the price rises much faster than the volumes, this indicates the absence of supply from sellers. A price growth that is not confirmed by an increase in volumes can quickly stop.
- Divergence. If the chart shows a divergence between the direction of the price and the indicator, there is a chance that the price will reverse following the OBV.
The OBV lows are almost at the same level, while the price lows are falling. The downtrend is not confirmed by a decrease in volumes, while the chart shows a divergence. The price decline quickly ends, and a long-term uptrend begins, confirmed by the volume growth.
Net Volume indicator
The Net Volume indicator is used to measure the net trading volume of the market. It is calculated as the difference between the volume of purchases and sales for a particular time period. It is used together with technical analysis tools to determine market strength and trend direction.
Indicator signals:
-
An increase in the indicator values indicates an increase in purchases, while a fall indicates an increase in sales.
-
If the price forms a new high and Net Volume decreases, this may indicate that the volume of orders from buyers is decreasing, and a trend reversal is possible soon.
On the current interval (equivalent to an H4 candle), the NV volume is 45.74K. Volumes and prices have increased. In the next section (next H4 candle), the price continues to grow, but the volumes of the NV indicator decrease to 14.78K.
If volumes fall when the price rises, it means that the price will most likely go down on the next candle. This approach can be used in intraday strategies.
Volume Indicator
The Volume indicator displays the volumes of assets bought or sold over a certain period. The green color of the histogram column means that the volume of the current candle exceeds the volume of the previous one. The red color of the column indicates that the volume of the current candle is less than the previous one.
Indicator signals:
-
An increase in volumes with a price increase indicates a continuation of the uptrend.
-
A decrease in volumes indicates a decrease in the interest of traders, which can lead to a trend reversal (transition to flat).
-
Divergence. If the price of an asset rises while trading volumes remain the same or decrease, this may indicate a possible trend reversal.
A sharp increase in volumes (abnormally high green histogram bar) confirms the strength of the downtrend. Then the indicator draws smaller bars in red, which indicates a decrease in trading volumes. The downtrend is slowing down, gradually turning into a flat.
Better Volume Indicator
Better Volume is an analog of Volume with more settings. Accordingly, it gives users more information. Its columns are colored in five colors:
-
Blue. Several blue bars indicate that the current volume values do not go beyond the standard ones. The trend is not about to reverse.
-
Yellow bars indicate a small trading volume. They are most often small and appear at the end of a trend or during a correction.
-
Green bars show the growth of non-standard volumes. They may indicate transactions by large investors. The trend, in most cases, does not reverse.
-
Red bars indicate a significant buyers’ prevalence in the market. The highest red bars may indicate a downtrend reversal or the start of a bullish correction.
-
White bars are the opposite of red bars. They mean a sharp increase in the sellers’ activity, an uptrend reversal, or the beginning of a bearish correction.
The red bar that appears indicates a sharp current surge in trading volumes but does not guarantee the uptrend continuation. The next section is flat. Blue bars with a small yellow bar indicate average volume values. The white bar shows the prevalence of sellers and the short-term price decline.
VWAP Indicator
The VWAP (Volume Weighted Average Price) indicator is the weighted average price of an asset for a certain period, weighted by total trading volume. It is used to determine the general trend direction of an asset and identify support and resistance levels. It is calculated by multiplying the price of each trade by its volume, then summing these products and dividing the resulting amount by the total trading volume for the period.
If the price is below the VWAP indicator, then trade opens at a price below the market average. Therefore, a price reversal under VWAP and its crossing by the price from bottom to top serves as a signal to open a long trade.
The red line is the indicator line, and the blue line is the price line. The breakout of the indicator line by the price from top to bottom indicates a downtrend. A bottom-up breakout indicates an uptrend. The chart shows that this rule is not always observed. Therefore, the indicator is used only as a confirmation of the signals of other instruments.
Advantages and Disadvantages of Trading Volume Indicators
Advantages of indicators displaying trading volumes:
-
Allow to predict a potential trend reversal, the beginning of a flat, or an exit from it.
-
Help to identify potential trade opening points. For example, a sharp increase in trading volume after a period of calm may indicate the beginning of a strong movement.
-
Confirm signals. For example, an increase in prices and volumes indicates that traders are ready to increase trade volumes in the direction of the trend. The trend is confirmed. If the volumes do not grow when the price rises, the price movement has no logical confirmation, and the growth can end at any moment.
-
Large trading volumes can indicate strong support and resistance levels. When the price reaches a support or resistance level and the volume is significantly higher than the average, this indicates the significance of the level and its continuation in the future.
-
More objectively reflect changes in the market. For example, when averaging prices over a certain period, trading volume changes are also considered.
Disadvantages of indicators displaying trading volumes:
-
There are relatively many false signals. Therefore, these indicators are used only to confirm the signals of the main instruments. Less often, they are used for a preliminary assessment of the state of the market.
-
Lack of a universal approach to interpretation. Indicators show different values depending on the settings and their calculation. Therefore, their signals are not always accurate.
-
Delay. Trading volume indicators display information with a delay of several candles.
-
Lack of information content during periods of low activity of traders.
-
Lack of information content in markets with low liquidity. When trading such assets, volumes can be volatile, and indicators can vary greatly depending on the trading session.
Volume indicators are not perfect. To get started, try them on a demo account, set them up in the strategy tester, and combine them with signals from other indicators.
Conclusion
-
Volumes are divided into horizontal and vertical. Horizontal ones show the number/volume of trades carried out at a specific price. Vertical ones show the number of trades or an asset for a fixed period.
-
On the exchange, trading volumes are calculated as the number of shares used in trades, for example, in one day. It is impossible to calculate real volumes in Forex, so tick data which signifies the market’s smallest possible price movement to the right of the decimal, is used.
-
The volume increase confirms the trend direction and indicates an increase in volatility. Small volumes indicate that the asset is low-liquid. It also means that the trend has ended, and the flat has begun.
Trading volumes are an additional tool that confirms the signals of other indicators and patterns. The system of searching for the relationship between an asset and price movement to identify the strength and direction of the market is called VSA analysis and refers to non-indicator trading systems.
The content of this article reflects the author’s opinion and does not necessarily reflect the official position of LiteFinance. The material published on this page is provided for informational purposes only and should not be considered as the provision of investment advice for the purposes of Directive 2004/39/EC.
منبع: https://www.litefinance.org/blog/for-beginners/trading-volume/